
After the difficulty I had with the Web of Science for the Citation Analysis Exercise, I was pleased that the first topic of interest I chose for the Network Analysis Exercise, “medievalism,” generated 482 results from the Web of Science. For this blog post, I will discuss two of the networks I created in VOSviewer using data generated by the Web of Science.
Network 1
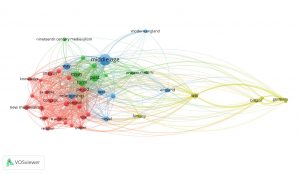
This network is based on text data from the journal articles’ title and abstract fields using binary counting, which only counts whether a term is present or absent in a given document.
The map that visualizes this network shows that the term “middle age” has the highest occurrence among the seventy-seven terms with a minimum occurrence of ten; “middle age” has an occurrence of ninety-six. For comparison, the terms with the lowest occurrence are “remembrance,” “medieval memory,” “person,” and “medieval period,” each of which occur the minimum of ten. Interestingly, “remembrance” and “medieval memory” were the two terms with the highest relevance, at 7.83. The term with the lowest relevance was “present,” at 0.06. It also seems worth noting that while “new medievalism,” “neo medievalism,” and “nineteenth century medievalism” were included among the forty-six out of seventy-seven terms selected by VOSviewer based on relevance, the term “medievalism” was not.
I am interested in how VOSviewer uses the data generated by the Web of Science to determine which terms are grouped, or “clustered,” together using color in the network visualization. For example, “Britain” and “Germany” are grouped together using yellow, along with “great war,” “war,” and “fantasy,” but “England” and “modern England” are in the group designated by the color blue. To return to my observation on the term “medievalism” not being selected as a relevant term, I am also interested in what relationship may exist between a term’s occurrence and its relevance.
Network 2
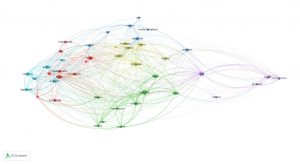
This network is based on text data from the journal articles’ title and abstract fields using full counting, which counts all of the occurrences of a term in a given document.
For this network, I used the same parameters as the first network—text data from the journal articles’ title and abstract fields, selection of terms with a minimum occurrence of ten, and selection of the forty-six most relevant terms—except that, instead of using binary counting, I used full counting. The map of this second network resembles the map of the first network somewhat, though this network’s visualization uses six colors rather than four to group terms together, with the addition of purple and a second shade of blue. The terms included in the first and second networks, created using binary and full counting, respectively, also varied.
Terms included in both networks (or, terms counted by both binary and full counting) (26/46 terms):
analysis
author
Britain
debate
development
England
fantasy
Germany
great war
knowledge
medieval memory
modern England
narrative
neo medievalism
new medievalism
nineteenth century medievalism
novel
order
period
person
power
relation
remembrance
rhetoric
state
war
Terms included in only the first network (binary counting) (20/46 terms):
art
concept
context
essay
example
form
influence
medieval period
memory
middle age
modernity
past
present
relationship
return
role
text
tradition
use
way
Terms included in only the second network (full counting) (20/46 terms):
approach
country
field
hand
indigenous knowledge
interest
Joan
language
Morris
nature
nostalgia
place
play
research
romanticism
self
Shakespeare
sovereignty
Spain
violence
What can you learn from the bibliometric network you have created?
The bibliometric networks I created and the visualization of these networks using VOSviewer reveals prevalent terms and the connections, or “links,” among these terms in journal articles that address various aspects and instances of medievalism. While I have concerns about the data provided by the Web of Science, which I addressed in my last blog post and will refer to again later in this post, I found the visualization of this data to be useful in thinking about the ways in which these terms are related and how these terms have been used in scholarship.
How does your choice of data limit your analysis?
My VOSviewer bibliometric networks were created using the most prevalent terms in the titles and abstracts of journal articles included in the Web of Science’s Basic Search results for “medievalism,” with the range of the articles’ publication dates determined by Pitt’s subscription. As I mentioned in my last blog post, the restriction of the Web of Science’s searchable publications to academic journals of interest does not account for other publication formats, such as books, essays in edited volumes, and exhibition catalogues, or for material published prior to 1945, which is the earliest year included in Pitt’s Web of Science subscription. Using the Web of Science’s data reproduces its limits in VOSviewer network visualizations.
How can you structure your data to change your analysis?
The first and second bibliometric networks I created show how the structure of data and the way data are counted can change an analysis. By first creating a map based on text data using binary counting and then creating a map based on the same text data using full counting, I saw differences in the terms included in the networks, the relationships among terms, and the ways in which terms were grouped. I could also have changed my analysis by increasing or decreasing the minimum number of occurrences per term, or by changing my selections in other aspects of the map creation process.
What models of the academic world do these metrics produce?
The choice and structure of data based on the interests of those developing searchable resources, datasets, and visualizations or other forms of data presentation call into question, for me, at least, the extent to which such metrics should be valued, in general and in hiring, evaluation, and tenure processes in the academic world, especially when such metrics are used uncritically across fields of study, as we have discussed in class. I am having difficulty articulating my thoughts in response to this question, so I will be interested in hearing from others as we continue our discussion in class.
One thought on ““Medievalism””
Such a fun topic! Your point about the distinction the program makes between “new medievalism,” “neo medievalism,” and “nineteenth century medievalism” and the term “medievalism,” is similar to my questions I had about “South America,” “Latin America,” and “America.” As I mentioned in my write-up, I found the term “America” not helpful because it was so prevalent and already assumed in the journals I looked at so I removed it in one instance. However, terms like “South America” and “Latin America” remained – how does VOSviewer determine what is a term and what is not?
Likewise, I don’t understand the clustering. I wish maybe VOSviewer would provide a “header” for each cluster… When I experimented with removing “America” some of the terms’ clusters changed… why?