Friday Morning Session
Adriana Kovashka, Computer Science, University of Pittsburgh
Toward Human-like Understanding of Visual Content
We need functional searches for image searching. How do we do it? We type a keyword in a search bar in Google image search—the only reason it works is because images are tagged with text.
What happens if you have an image of something you want to look for and don’t have a word for it? Keywords don’t help. So you interact by describing and narrowing down what you’re looking for.
In an in-person scenario, a person responds with guesses which get closer and closer with more detailed description.
Is there a similar way to interact with a computer? (Well, computers can’t see…)
How is interactive search done today?
Let’s say you saw a person whom you think committed a crime, and you want to report their description to the authorities:
Enter “thin white male”
Try binary relevance feedback in the list of results—and exclude some as relevant and some as irrelevant.
Traditional binary feedback is imprecise; allows only coarse communication between user and system
Adriana proposes: Allow people to select one result and say: “Similar to this…but with curlier hair”: Search via comparisons: a “whittle search”—lets you “whittle away” irrelevant images via comparative feedback
Prior work: Semantic Visual attributes – essentially adjectives
High level descriptive properties shared by objects
Human-understandable and machine detectable
Middle ground between user and system
Primarily used in object recognition
Let people make relative comments on properties: yellow, spiky, smooth, natural, perspective open smiling etc.
Idea: Attribute Pivots for Guiding Feedback
Have the computer play a 20-questions game with the user:
A person wants to buy shoes.
The computer asks: “Are the shoes you seek more or less feminine than this picture?”
What questions should the computer ask?
Select series of the most informative visual comparisons that user should make to help deduce target.
This is like active learning—and it’s computationally expensive to evaluate all possible questions and figure out what the next question in a series should be.
Impact of WhittleSearch: Adobe Font Selection
Users retrieve fonts that match requested attributes and fonts are sorted by relative attribute scores. Example: fonts with these attributes: “not delicate.”
Lots of attributes are really subjective. PROBLEM: One Model DOES NOT fit all. But people want to build a single model for all users.
Valid perceptual differences within an attribute, yet existing methods assume a monolithic model is sufficient.
Ideas to improve: Learn User-Specific Attributes
Build a generic model that distributes a labelling method among a crowd. Adapt generic attribute model with minimal user-specific labeled examples.
Try to discover shades of attributes: Discover “schools of thought” among users based on latent factors behind their use of attribute terms. Allows discovery of the attribute’s “shades of meaning.”
Use the human gaze to learn where attributes “live”: Which parts of a face give an “Asian” quality or a “baby-like” quality?
Q: Which came first: Your list of adjectives, or people assigning independent adjectives?
A: Others have tried to evolve a vocabulary from scratch. She’s refining a generic model with more crowd labelling.
Q: Could you do any of this model refining by machine learning from where users click most frequently—and NOT based on conscious responses?
A: Yes, and that would be interesting, but that’s not what she’s been working on.
Q: Does the crowd influence people’s sense of attribute meaning?
A: Users don’t often deviate entirely from the crowd, but sometimes do.
Q: Is there “temporal drift” in a notion like “fashionable”? (How do attributes change over time?) These adjectives aren’t tethered to anything, are they?
A: I don’t have an answer to that—but yes there are cultural/spatial differences in people’s sense of fashionable. There’s a computer vision paper that studied how cars evolve over time.
Using vision to analyze aesthetics
Photographer identification: Can you tell who took a photograph from the photos themselves? Can you build a computer model that can discriminate among 41 different photographers and some hundreds or thousands of pictures.
Deep net features achieve 74% accuracy.
Studies gradients in a region of the photo—generate a histogram of gradients.
“Deep learning”: deep neural networks that are trained to distinguish between 1,000 object categories like person, couch, car, etc. Use whatever the network is giving as a classification. It’s called “deep” because it has multiple layers. Take the last layer of your network—what’s the probability that each of these 1,000 objects is present in your image? When we do that, the network achieves 74% accuracy. Chance is less than 3%. Human performance is 47%.
Method learns which proto-objects and scenes authors shoot.
This can be used this to develop “field guides” for human use.
This can generate photographs in the style of a given author: as in, GENERATE an Ansel Adams photo. They’ve had some positive early results.
Q: Is that done by subject matter, then? Identifying objects in an image?
A: Yes—objects and background are cues.
Q: Are you mostly looking at art photographers?
A: Yes, not looking at amateurs. It might matter because professional photographers will care more about image composition, etc.
Q: What about photographers with a wide range of subject matter?
A: Probably the model won’t work as well.
Make computer system generate a photo “by” a photographer: object and background comes through.
Predicting the “mystique” of a photograph:
What part of the image will viewer stare at? Called saliency: ability to predict WHERE the viewer will stare at a picture?
Q: How does this saliency model work?
A: Computer look for high contrasts, and faces.
Q: Does it matter whether you’re looking at a digital reproduction or a print photo?
A: Work in saliency ignores semantics.
We can use the conflict between connotations of works to capture “mystique.”
Analyzing body pose and image setting for visual persuasion: which images look more positive, favorable, powerful, comforting, competent for images of politicians?
It’s all human annotated.
Their test: Show users passages of text and ask questions, and then show them some images (as though it’s a break from answering questions about a text—just to get people away from an unnatural close analysis of pictures—distract the viewer to see how they’d actually look at a photo).
Christopher Nygren, History of Art and Architecture, University of Pittsburgh
Heads, Shoulders, Knees, and Toes…Computational Art History
Look at portrait of Senator Giovanni Morelli, 1886 by Franz von Lenbach: the social history of art history dismissed the formalism of this picture.
Morelli and his benighted method shows us something about “semantic reduction”—how was this done 150 years ago?
Trained as a doctor in Switzerland, Morelli lived off of inheritance with odd jobs. He was associated with art dealers and collectors, served as a senator after the Risorgimento, and became a founder of museums in Italy.
Starting in 1874, Morelli published things in German under pseudonyms (including Johannes Schwarz—“Morelli” means dark or black, as does “Schwarz”). These publications gave art historians a “Morellian method” written in dialogic form.
Morelli’s method animated a deep-seated contempt for academic context of 18th and 19th century Paris and Germany—“spits venom” at these places, and at collectors. He said these people spoke in sweeping generalizations—dismissed them as “art philosophers” wont to look at pictures as though they were mirrors.
Morelli proposes “the connoisseur” as opposed to these “art philosopher”—The connoisseur has the proper means to judge: “The only true record for the connoisseur is the work of art itself.” The “general impression” matters to Morelli’s connoisseur.
Studied Giorgone—too many pictures had been ascribed to him—Morelli was trying to purge the corpus of misidentifications. How did he do it, and why does it matter to computational aesthetics?
Detail matters in places where painters are expending the least attention, rather than the most.
Beauty follows very generic patterns based on Petrarchan ideal.
Instead: Anatomical features like fingernails, toes, noses—became the locus of Morelli’s classifications. Features such as Titian’s adherence to a rounded ear and a round ball of the thumb.
But Morelli fudges a bit—images he sketches don’t quite match the pictures he says he’s talking about. It could be that he’s pulling from other pictures as models for the generic hand Morelli sketches as “typial” of a Titian hand. But that’s the point—it’s an iterative model. Morelli’s work is littered with illustrations which are profoundly alienating: nose, earlobe… these offer a schematic rendering of those details.
Morelli would probably have used photographic details if technology allowed… instead he uses line engravings—he’s going for the most salient feature and so eliminates contrast and tone, among other elements of a painting.
There are tonal qualities that make a Titian a Titian and “incarnating flesh on canvas” (paint that becomes flesh). It seems that Morelli does “aesthetic violence” to this. Morelli himself recognized that his method was disconcerting.
Morelli was working around the same time as Arthur Conan Doyle and Sigmund Freud. These methods predicated on an emergent form of diagnostics. As Carlo Ginsberg described it, the art historian became a detective.
Medical doctors today like to look at pictures to diagnose issues like breast cancer in them—very dodgy, and not quite what Morelli was doing, but related to the diagnostic approach.
But the idea of identifying Minimal degrees of variation with maximal consequence is potentially important to computational visual aesthetics.
Q: Isn’t this what the GIST algorithm does—with identifying proto-objects?
Q: Does Morelli ever show us some sketches that he gets absolutely right?
A: Yes—his ears!
Q: What about Morelli developing a typology—Do we see him draw this in grids?
A: When he does that—the ears are again probably the best examples.
Photographic details would not serve Morelli’s purpose: he needs abstraction.
Is the abstraction a level of “Platonic ideal”?
Q: Maybe the abstraction makes it “scalable”?
A: Yes: attempt to identify principles that will help people in museums.
Q: But this is so deeply problematic. Museum community importance, but art historians so deeply rejected Morelli that THIS WAY of thinking about the world helped make the digital computer possible and at the same time alienated art historians
A: Art historians call Morelli’s practices a kind of “violence” to Titian.
Q: Why did art historians reject this and “move on”?
A: Because it was too schematic a model: We’ve realized that what we call “Titian” is actually a bunch of people working in his workshop—he has a production model—a number of specialists who help out. Morelli takes a given the unitary act of creation, but art historians have pushed back against us.
But Morelli also taught us how pictures are created. This makes us wonder about the concept of “obsolete.” We’d question whether really Morelli is obsolete—we just don’t want to admit the importance of his presence.
In the worlds of textual scholarship, manuscripts/medieval paleography, Morelli’s presence is important. What we’re rejecting is the ideology of the dilettante white male who kicks around in a museum.
Q: Conservation and chemical based data—that’s connected to Morellian thinking, right?
A: Yes—look at canvases and their warp and weft.
Q: We in computer science do this Morellian abstraction. Computer scientists want the language they need to describe something closely enough to predict. And Morelli’s example is compelling for its failure.
A: Yes—it’s compelling for failures combined with major breakthroughs.
Q: The problem with Morelli is that it was all predicated on who was the painter. And that’s all about the question of how much the painting is worth—all about money.
Q: How much is art history is still about that?
Discussion: We’re all in a land of subjective interpretation, and the computer can give us something to interpet.
On subjective aspect, take Isabella D’Este—the wife of an important man, left in charge when he leaves town. Leonardo portrayed her at the age of 20-25 in 1490 versus one made later by Raphael when she was 60 (and she looks younger, and loved this picture). I suppose the donor matters.
Q: Can we train computers to want to see? The way humans want to see?
A: We can use the computer to track human eye-path in gazing at picture… why couldn’t volition be modelled, then?
Benjamin Tilghmann (Lawrence University, WI)
Complexity and Emergence in Early Medieval Art
Two areas of focus:
The volitional aspects of seeing in medieval northern Europe: What practices of seeing were expected then (not normally associated with practices of seeing in Western art)?
Compositional/geometric method that went into interlace “carpet” pattern of Lindisfarne gospels.
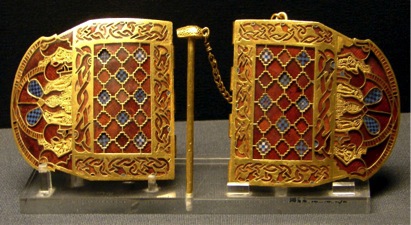
Slide of shoulder clasp from Sutton Hoo site:
Helmet from Sutton Hoo—looks like it’s got a mustache—but those are tailfeathers attached to a bird:
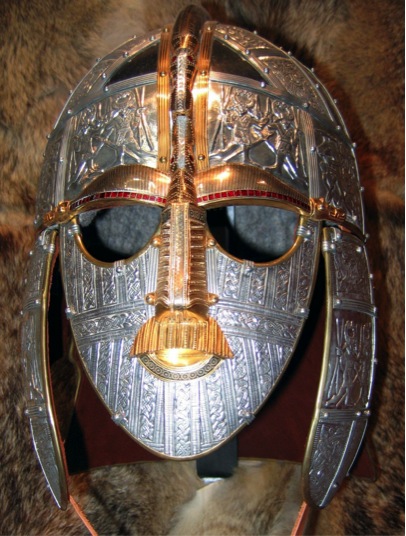
Calling the power of an animal on the artifact. The form of an animal might have symbolized trust or power. A way of subtly or quietly signaling affiliations, perhaps.
Point about viewing:
A strongly active process; demanded a lot of mental work.
Computer/computational viewing: The kind of parsing people did in past centuries is something we can get computers to do with isolated examples, but we have so much coming out in archaeological sites. If there were a way to parse all of those objects as a group, that would be very helpful to us.
What would one want to train a computer to see?
Carpet Pages: See https://en.wikipedia.org/wiki/Carpet_page
Why are these used to illustrate the Bible (in Northumbria 8th century) instead of literal images? To encourage readers to slow down the reading, think, tease out a knot?
Consider how these were made. Did the process of making affect the way these were received?
The act of ornamenting may have had meaning.
How were these made without the aid of mathematical tools that we would expect to be necessary? How did they do the page layout? Could it be done with a straight-edge and a compass? Robert Stevick (The Earliest Irish and English Bookarts) has attempted to model how this might work with diagrams.
There are no gridlines on the page. The idea is that you start from a center point and generate arcs, find two points where arcs intersect and draw lines between the two. So each step leads to the next steps.
Most art historians dismiss Stevick and have little to say about him.
An idea: the artist might not have started with the entire pattern in his head.
But we do have “backdrawings”—on the reverse of the folio page you can see grid marks. It seems like tracework might have been involved—maybe with a light table with thin alabaster and a lamp for backlighting.
The way we write about this is as if it’s “illuminator’s hacks”—but what meaning could this process have had for the makers? Did the apotropaic (protective) aspects of these patterns contribute to their making?
Notice patterns made on swords such as the Sutton Hoo swords, Palace of Westminster sword, 9th century: wave-marked striations from twisting, flattening, and folding the iron in forging the sword. These tempered the iron – strengthened it – and generated patterns that people associated with strength, too. And the patterns came to be desirable for their own sake—semantics pulled from the object.
There is a connection between process and product.
Emergence—shapes and forms are arrived at through the operations on the material. Emergence complicates and undermines the traditional understanding the genius author. Makes the makers be people applying geometry and applying its rules.
But the compositional structure of pages like the Lindisfarne carpet pages often don’t break down into readily rationally distinct units. Sometimes they depend on irrational numbers as much as on whole integers…and Augustine doesn’t give us a mystical interpretation of the square root of two.
We don’t have statements from the artists/makers, but maybe there was an idea of a divine process guiding the hand of the maker: phrases like “the work of angels.” Describers of these texts from the Middle Ages might have really meant it: Angels show the scribes an ideal image: “Can you make this?” Scribe: “No.” But on encouragement, the scribe is encouraged to open his eyes and record the vision in his mind more precisely. Divinely given exemplars.
“Well knitted” illuminations—connected to interlace patterns.
Divine use of geometry: re the Tain of C’ooley (Battle raid of cooley)
Order to make a magical shield, or die… description of how it’s made in the Ta’in.
Idea of God using algorithmic geometric methods. The idea of a logic to the bible and its numbers and shapes. These told the story of a process. God wrote the code, which is played out (compiled).
Computation had to be done to reckon calendars—to determine the structure of time . The methodical order to God’s creation. Orderly method, then, a process guided by God the algorithmic Maker.
Also requires an observer, who will recognize their significance, as opposed to white noise. Patterns exist only in our perception of nature—patterns dependent on human discernment and subsequent viewers. The act of ornamentation, connected with act of interpretation: art as a way of enchanting the reader into an appreciation of the divine.
Q: This reminds her of what Wendy Chun has written of what we fetishize about computers—that computers WILL help us see what we can’t.
A: You were the one who raised the point of Platonic ideal.
Q: What about eyesight necessary? They didn’t have glasses yet?
A: Actually, they had quartz crystals, etc. See https://en.wikipedia.org/wiki/History_of_optics
Book of Kells: The script is beautiful of the texts are seriously problematic, error-ridden. This was designed for its images. Books were held up high, processed through the community with pages open.
Strong overall compositions, but intricate stuff you could glimpse from a distance but couldn’t completely see. Who gets to see what and where? Partial seeing depending on the audience.
Thomas Lombardi,Computing and Information Studies, Washington and Jefferson College
Interdisciplinary Approaches to Metadata
Wants to connect the work he’s doing in social and life sciences to see if there are touch points between their work and what people do with art history data. This is very experimental.
Annotation-Driven Research:
Biology and bioinformatics
Differential Expression (with cyanobacteria—can you change the metabolism so it can make an alternate form of energy? Can you make it process something different: Read its RNA to see what makes a differential expression. This kind of work is really important in bioinformatics now.
Economics: uses market basket analysis to try to understand patterns in consumption (What do people buy together in the same basket: Guys buying baby diapers and beer together, high correlations)
Sociology/Computing /Ecology: network analysis usage
Test Case: Metadata from the Index of Christian Art: Lots of metadata, describing the kind of painting, its location, its subject matter (so Tom could build networks of medieval saints from the metadata set)
And Tom created his own data set from William R. Cook’s Images of St. Francis of Assisi in painting, Stone, and Glass from the Earliest Image to ca. 1320 in Italy (1996)—That was a project he worked on with a mentor when Tom was his undergrad research assistant.
The Black Death and its Effect on Iconography:
Iconographic Shifts: Aquinas & Dogma, new pairings of saints (“plague saints”).
Regional Differences in Florence versus Siena
Could he take techniques from biology and network science, take differential expression from Bioinformatics find the genes that are behaving differently in control versus test groups
Biologists’ work is largely driven by metadata: from a verbal description of what a gene does, put in an annotation file. It’s an ontology file (much like what we talked about in Network Ontologies workshop last year). Shows a bioinformatics network analysis of differential genetics in a hornworm. Which genes are being overexpressed—these are highlighted in the network graph.
Biologists do a lot of exploratory analysis: just looking for things.
Looking for places where there’s anomalous behaviors—places where wild type and mutant don’t match up. Write annotations about that. That supports the ontologies of biological research.
Tom says: I have a theory and I have a technique, and I found the following results about iconography changing after the Black Death. 1350 was his cut-off—because it turned up most often in the metadata.
Portraits of St. Anthony the Great : Before 1350: 7; After 1350: 63
Lawrence of Rome (Tuscany): Before: 4; After: 25
Virgin Mary and Christ Child: decrease (Before 168; After 93)
Madonna and Humilty: Before 2; After 25 (Tom says it could be the Madonna images with child are different)
Annunciation before and after:
Florence: 36-34
Siena: 17-46 (Big change here, but not in Florence)
Q: How are we typing the images?
A: There might be problems with my typing, sure, but St. Anthony’s not ambiguous.
i.e. I’m just doing exploratory analysis—interpretations are going to be problematic!
Q: There’s a survivability bias: we only have a tiny selection of images from that time.
A: How we can use this metadata to do something interesting? Next stage of project is to do something that applies to the whole corpus.
Back to Market Basket Analysis: What do customers tend to purchase at the same time?
For example, bacon and eggs, soda and chips.
Businesses use this info to maximize marketing potential and explore brand affinity.
Is there affinity in the groupings of saints in our “market basket” of icons?
Can we find new arrangements of Saints or regional variants of arrangements?
Because this technique produces so many results, there’s a serious problem of how do we filter? But it does lead us to network analysis.
Food webs: Can we model the predator/ prey behavior in an ecosystem? Build incredibly detailed, iterative-based exploration of the contents of thousands of bass’s stomachs. What can be done with all that data?
Ecologists use this information to support conservation and predict likely effects of environmental threats.
If Tom tries to make networks like this of medieval saints from the data we have:
Art historians isolate all the saints.
Any time these saints are juxtaposed, they are connected: (Christ, Mary, and John—wherever they appear together).
Bioloigsts looking at Tom’s images of saints started talking about food webs. The saints at the top are like the predators in this comparison.
Maybe these images go through a survival cycle like species do. How to species and images survive over time? Think about the pressures of “consumer demand”—the contracts of what people requested: I want the Virgin painted in this way, with this context, with a local saint, etc.
Ways to refine the model: Try to create a directed network to capture rank
Can we get prestige newtorks? Known data on popularity of certain images over time.
Comparative line graphs of how popular Christ, Mary, John the Evangelist and Michael are synchronized.
Clare, Anthony of Paua, Louis of Toulouse—very tangled up—difficult to figure out where to put everyone in the picture. Some saints begin to displace other saints.
“These symbols are kind of signals,” says Tom. There’s an influence from culture—the Seraph and the stigmata become important at certain moments.
What’s the potential for this?
Q: Chi square must change depending on the date. What if we chose saint pics tracking from the year 2000?
A: This isn’t about statistical approximation—the numbers are real counts. But the question refined is: How do we know our marker (of 1350) really has meaning?
A: Computer scientist answer is that we go over and over and make sure we get thee same results
Q: What about the size of the data set? How much smaller is the art history set?
A: Well there’s de-duplication that has to happen, but, the cyanobacteria model has 4,000 genes, and art history database has around 2,000 entries.
And in many cases the metadata from art history is more clear , but roughly similar scales.
A: The difference is art historians don’t have a sameness in the way biologists do. Is art history more anomalous?
Discussion: The idea of Computational Sublime, this effect of what we think we’re seeing that we couldn’t before—exerts a mystique.
Terms that emerged on whiteboard:
- Saliency
- Subjective description: forms, emotions
- How do humans see? What do we want to see? (Volition)
- Medium-specificity/photography vs. painting
- “Semantic gap”
- Gestalt vs. details (proto-objects)
- “Scientific” art history
- Metadata vs. image features
- Who is privileged to see what?
- Contingency of observation
Friday Afternoon Session
What are ways to connect artworks in a network that aren’t based on figures?
How can art history usefully expand the notions of nodes and edges?
Tom asks: What about what works of art are exhibited in the same time/place?
Ideas of co-occurrence: provenance research, collections
We’re talking about information about the networks, about metadata. But what about the data itself? The contents of the image? The occurrence of particular images, icons?
What about “the golden section” portion of an image
Tom asks: If there’s a way to assess the perspective shifting—to say, 60% of the image is red, or the perspective is skewed X amount…is that useful data?
Student answer: No, but she can think of people who would care about it.
Rae’s example: 83 artists in 19th century Vienna, synthesizing futurism, and other movements. Approximately 600 artworks.
Alison: The idea here is to explore beyond what we think we know based on our categorical interpretations.
Influence: in art history, a particular style is passed down over generations. A story of passive reception. And then again, it’s in how we interpret it.
Lacking empathy with the neural net, we don’t understand how a computer amalgamates two images. Take a photograph and render it in the “style” of five different artists: What is being captured in the computer algorithm?
How does a computer convert an image into channels of color? Maybe the lines aren’t as crisp as they look to us.
Alison: I get stuck on this: Art historians won’t be interested unless it’s a multi-variate analysis—across things that we won’t comprehend easily at once.
What can art historians in their data sets identify as grounds for “sameness”?
Alison: Because we put things into categories, it’s insane not to be able to categorize.
I ask about topic modelling on images, and Adriana says—yes, that is being done: you can topic model based on “patches” of images.
What’s the locked room experiment for the art historians and computer scientists?
Can the computer SHOW the patterns and art historians FIND it?
Topic models = a type of algorithm that generates a “bag of words”
Dump all the words from the corpus in one bag so you lose all relative semantics
It can stem the words (sleep, slept, and sleeper become the same words)
It can remove the stop words (low TF/ IDF term frequency over inverse document frequency)—remove them from the document
LDA (latent dirichlect analysis) –statistical frequencies of co-occurrence. You enter a number of topics—which ones are most likely found together?
The computer doesn’t “know” the topics—the human reads them into the results of the LDA. How would this translate to images?Sounds like you can pick an image feature: LDA is about distributing tokens over a space. It would just group based on what tends to be together.
MALLET runs and groups, and also locates the articles, letters, or clusters of paintings where these tokens cluster together most. The humans read those, and then decide on whether it’s a meaningful association.
Would it be worth trying? Ben says: it might force art historians to think about what makes something meaningful.
What about saliency?
Adriana said what’s salient is what the computer could see. It was a model she trained; it’s where the computer predicted what humans would latch onto.
One semantic feature is faces—computers can easily differentiate among faces, but other things were lower level: sharp edges and contrasts.
Tom: What about moving back to the 1930s methods: Wolfflin, Arnheim…those who measure formal features (a little closer to Morelli)? It was of interest in the 1930s because people imagined computers around the corner.
Ben: Wolfflin thought he was describing a “universal viewing practice”—but we now understand that to be an elite viewing practice.
Alison: We have trouble getting content/form based image analysis into a social history of art.
Discussion turns away from paintings and into other forms, more reproducible like prints.
Tom mentions authentication software, forgery of signatures, drawings.
Alison: Maybe there’s more sameness to pull from in drawings and prints.
Color would matter for different reasons. Look at multiple different drafts of the same drawing
Things art history thinks of as digital:
- Metadata studies and GIS
- Spectrum analysis, x-rays
- Content-based analysis
- 3-D models…(3-D printing of sculptures)
- It’s different from algorithmic and spectral analysis, and more to do with re-creation and what it can mean. Models architectural spaces, including getting the sound patterns right: And some of these are game environments like Assassin’s Creed or Second Life. (A grad student found her experience years ago in a class valuable for “experiencing the historical context of a space.”)
What do we want 3-D modelling to do? Is it working backwards to figure out how it was made? Or thinking forward to see how people interacted with work?
- It’s different from algorithmic and spectral analysis, and more to do with re-creation and what it can mean. Models architectural spaces, including getting the sound patterns right: And some of these are game environments like Assassin’s Creed or Second Life. (A grad student found her experience years ago in a class valuable for “experiencing the historical context of a space.”)
Alison: Paintings are 3-D, too. How do we experience that by placing them in a room to tell a story?
What’s the difference between that kind of curation, and networking collections?
(Control over how people move their bodies and eyes through a gallery.)
Recalling the term “fashionable” from Adriana’s talk— these methods rely on value-laden categories. Humanists in general have become keen to scrutinize.
Face classification—used to run through computer algorithms to identify scariness, in airports.
Benjamin Schmidt’s work with gendered language in teaching reviews: demonstrating clear male-female split over perceptions of humor, across disciplines.
Digital Methods as Activism: push against “volitional seeing” re: how race categories work.
A Digital project that goes looking for images of differences to wake us up about our biases.
Alison: The soup we were raised in is making us see a certain way, and that’s what the computer is going to show us. We have to stand outside that soup and look at it.
The computer will show us the soup of the photographers. We can’t get outside the soup. We can’t assume the computer will show us some truth we can’t see.
Tom’s question for the group: What can we learn from data, versus what can we learn from anecdote?
A: Cognitive psychology is finding that people aren’t convinced by data.
A: We’ve had data about the abuse of black suspects by police for decades. And yet specific anecdotes and powerful images connected to Rodney King have a stronger impact.
A: People won’t understand data unless it’s coming to them through a familiar frame of reference
Tom: Data and statistics are deeply uncomfortable to people, or so the data shows us.
Special case versus generalization: What’s the interface that negotiates between data and anecdote?
Warhol Museum’s exhibit : http://withoutsanctuary.org/main.html
The record of people’s comments at the museum is they were surprised and angry they had not learned about this history before. The idea of having been deprived of the knowledge of our soup is deeply disturbing to us. So maybe it is compelling for people to learn.
Do museums seem to have a better chance at this maybe than academia?
Ben shows us collections of racist images of blacks—usually curated by blacks because white collectors don’t want to be seen with them. But black collectors are also criticized for it. But still, we want to know.
Prior to the internet, only the museum could reveal these collections. But the internet isn’t always such a nice place for disseminating this history .
Public Humanities
Digital Humanities versus Art History—art historians tend to want to take us back to the object, and DH seems to move us away from the physicality of the object
Wrap Up—return to Basic Categories of Art & computer analysis overlap.
Things Art History thinks of as digital:
- Metadata studies and GIS
- Spectrum analysis, x-rays (“science”)
- Content-based analysis (topic modelling is included here)
- 3-D models…(3-D printing of sculptures)
- Public humanities
Discussion: Let’s add more:
- Preservation and Presentation, but not for the public. For funders/donors.
- Conflicts: Social history of art vs. Connoisseurship
- material studies vs. textual studies
- open-ended conflict: what’s our basic unit of analysis?
Things Art Historians do:
- Assume chronology matters
- Look for Special case—seems more interesting
- Sometimes about curation—linked to archaeology
Things Computer Scientists do:
- Assume all will center on the algorithm
- Tell me what Art History is?
- Look for irrefutable patterns
No Comments